
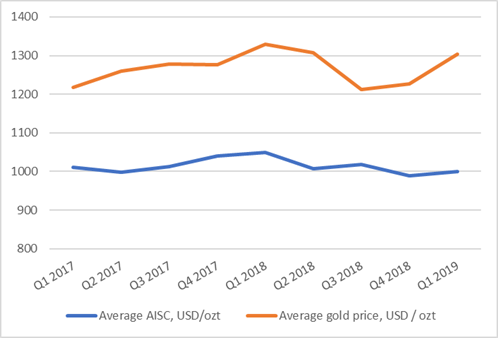
In the first quarter of 2019, the global gold market continued to recover from the two-year lowest average price point of $1,213/ozt recorded in Q3 2018, rebounding to $1,304/ozt in Q1 2019, the second consecutive quarter of growth.
MINING.COM analysed the effect of the gold price on the gold mining industry using data from sister company Mining Intelligence’s proprietary Data Application. The data we used represents companies reporting quarterly production and listed on the following stock exchanges: TSX (+TSX-V), ASX, LSE (+LSE-AIM), NYSE, and JSE.
We looked at four metrics: quarterly gold production, all-in sustaining costs, operating income and capital raisings. The data indicates the following: Reported global gold production for Q1 2019 was 15 Mozt, or down about 11% compared to Q4 2018.
Reported global average quarterly all-in sustaining costs were 1% higher than in Q4 2018. Overall, gold producers managed to keep costs under control. Major gold producers’ global aggregated quarterly operating income followed the gold price and increased by 54%.
Capital raisings completed by gold producers, developers, and explorers were down by 60% from Q4 2018 to Q1 2019 indicating investors were not ready to raise stakes yet.
Reported global gold production
For the Q1 ending March 31, 2019, global reported gold production totalled ~15 Mozt, or down ~11% compared to the previous quarter. Production decreased in all major regions. North America was the largest gold producer (3.8 Mozt), followed by Africa (3.2 Mozt), and Australia & Oceania (2.9 Mozt).
The three regions that contributed most to the 11% quarter-on-quarter decline in global gold output were North America (-494 kozt, or down 11%), South America (-352 kozt, or down 15%), and Africa (-342 kozt, or down 10% from Q4 2018).
By the end of 2018, Ghana took the top spot as the biggest gold producer in Africa from South Africa, which continues to struggle through Q1 2019 and, as a result, produced 23% less gold than in Q4 2018. Quarter-on-quarter production gap between those countries accelerated to 34% (+176 kozt) in favour of Ghana.
While South Africa’s gold mining sector is scrambling to survive amid increased production costs at underground mines, socio-political turmoil and regulatory headwinds, Ghana and West Africa as a whole are quickly becoming the continent’s main gold mining hub.
Production in Asia took yet another nosedive — dropping 26% due to significant decrease in gold output at Indonesia’s Grasberg mine.
Despite quarter-on-quarter decline, Q1 2019 reported gold output was on par with Q1 2018 numbers and this fact – considering the cyclical nature of gold production – gives hope that further in 2019, gold mining industry will be able to at least keep the pace with the previous year.
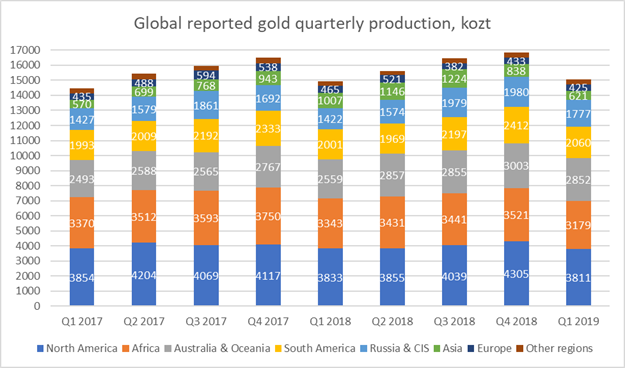
Global quarterly gold production, regional level, Q1 2019 vs. previous quarters, kozt.
All the top 10 biggest gold mines reported a production decline, with the most whopping slump (-229 kozt, or down 59%) recorded at Grasberg mine, which is in the transition from open-pit to underground operations and have already lost seven positions in the ranking, dropping from being second in Q4 2018 to barely clinging to ninth position in Q1 2019 (Table 1).
Despite 9% drop in output, Barrick’s Goldstrike production center in Nevada, USA, retained the world’s lead gold operation status (Muruntau mine is excluded due to lack of data), well ahead of its competitors.
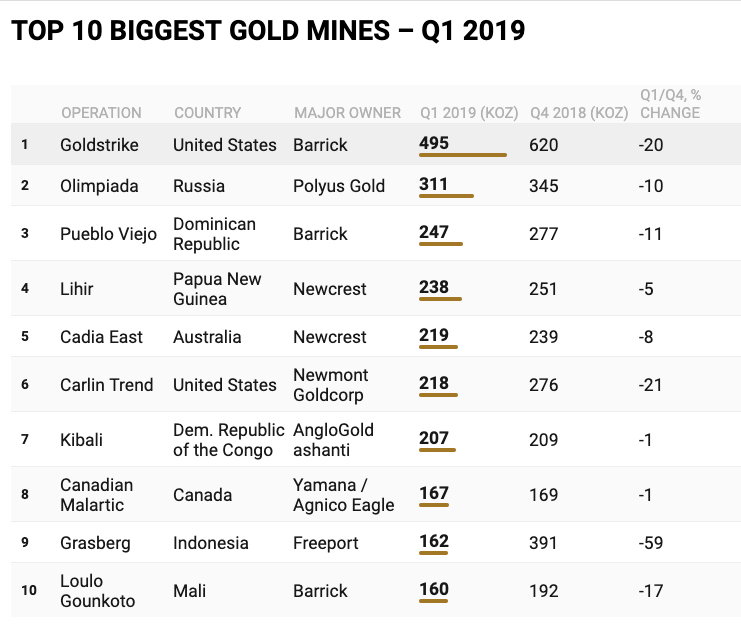
Second and third in this ranking are Polyus Gold’s gigantic Olimpiada mine in Russia (311 kozt) and Barrick’s Pueblo Viejo mine in Dominican Republic (247 kozt).
Centerra Gold’s Kumtor mine (Kyrgyzstan) and AngloGold Ashanti’s Geita mine (Tanzania) dropped out of the top 10 list while Yamana / Agnico Eagle jointly-owned Canadian Malartic mine (Canada) and Barrick’s Loulo Gounkoto operations (Mali) entered the ranking landing on the eighth and tenth positions, respectively.
Reported global average quarterly all-in sustaining costs
Global average all-in sustaining costs (AISC) rose insignificantly by 1%, from $988/ozt in Q4 2018 to $1,000/ozt in Q1 2019. This indicates that companies, overall, kept their costs under control. In Q1 2019, six out of the top 10 lowest cost mines further decreased their AISC compared to Q4 2018.
With $315/ozt recorded in Q1 2019, Kirkland Lake’s Fosterville mine in Australia was the lowest cost gold operation for the second consecutive quarter measured by AISC. Fosterville’s ore grade was 29 grams of gold per tonne of milled ore, making this the world’s second highest-grade major gold mine in Q1 2019, behind only Macassa mine (Canada) owned by the same company.
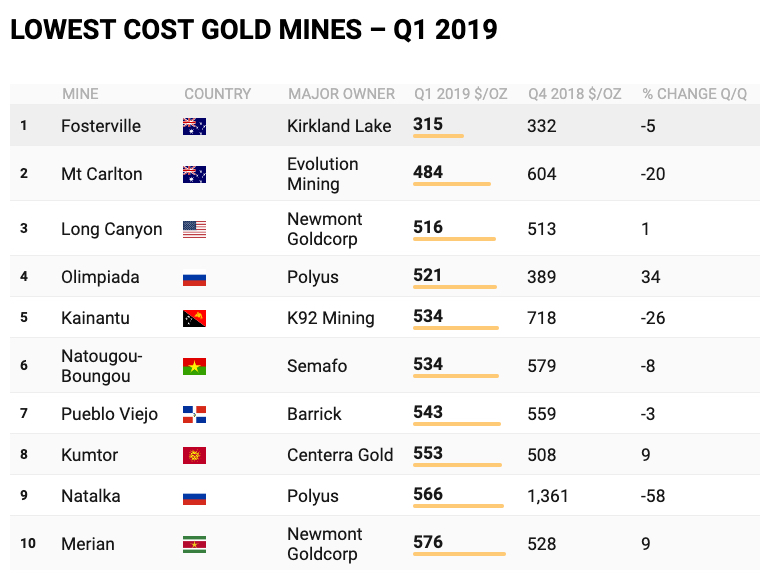
Fosterville was followed by Evolution Mining’s Mt Carlton mine ($484/ozt) in Australia, Newmont Goldcorp’s Long Canyon mine ($516/ozt) in the United States, and Polyus Gold’s Olimpiada mine ($521/ozt) in Russia. Mt Carlton (Australia), Kainantu (Papua New Guinea), Natougou-Boungou (Burkina Faso) and Natalka (Russia) mines were newcomers to the top 10 lowest cost gold mines ranking in Q1 2019, while Neryungri (Russia), Copler (Turkey), Moose River (Canada) and Hounde (Burkina Faso) mines have left this competition, at least for the time being.
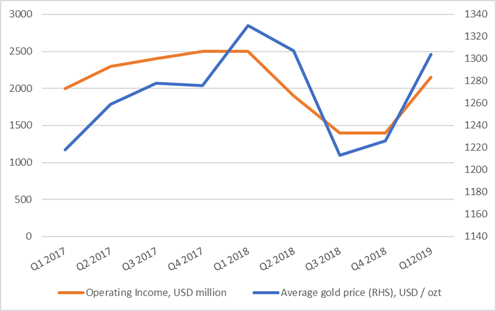
Reported operating income
Major gold producers’ global aggregated quarterly operating income followed the gold price and increased by 54%, from $1,400 million in Q4 2018 to $2,150 million in Q1 2019. Overall, companies kept costs under control and this, coupled with improved gold market, helped gold mining industry to improve its aggregated financial performance.
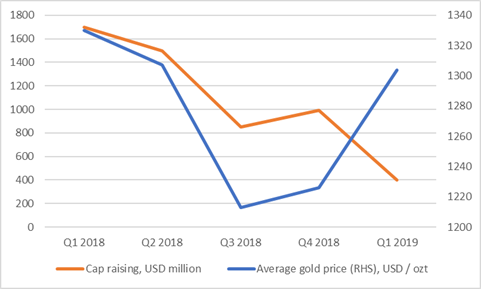
Completed capital raisings
The strength of equity markets is a barometer of investor confidence. The amount of capital raised through equity placement directly reflects the sentiment in the mining industry. This indicator shows that in Q1 2019, investors were very cautious while consider investing in the gold mining industry, with gold producers, developers, and explorers at major exchanges raising 60% less capital compared to Q4 2018.
Note: quarterly gold production reported by publicly-traded companies accounts for about 65-70% of total global gold production and can be considered an indicator of the overall state of the global gold mining industry.
Mining Intelligence focused on primary gold operations’ AISC, i.e. mines where gold contributed to 90% and more of revenues from operating activities generated during the quarter. The ranking excludes tailings re-processing operations, mines where the precious metal is produced as a by-product, and operations where companies report gold-equivalent output.

